1. The Engineering Compromise: A Real-World Failure Scenario
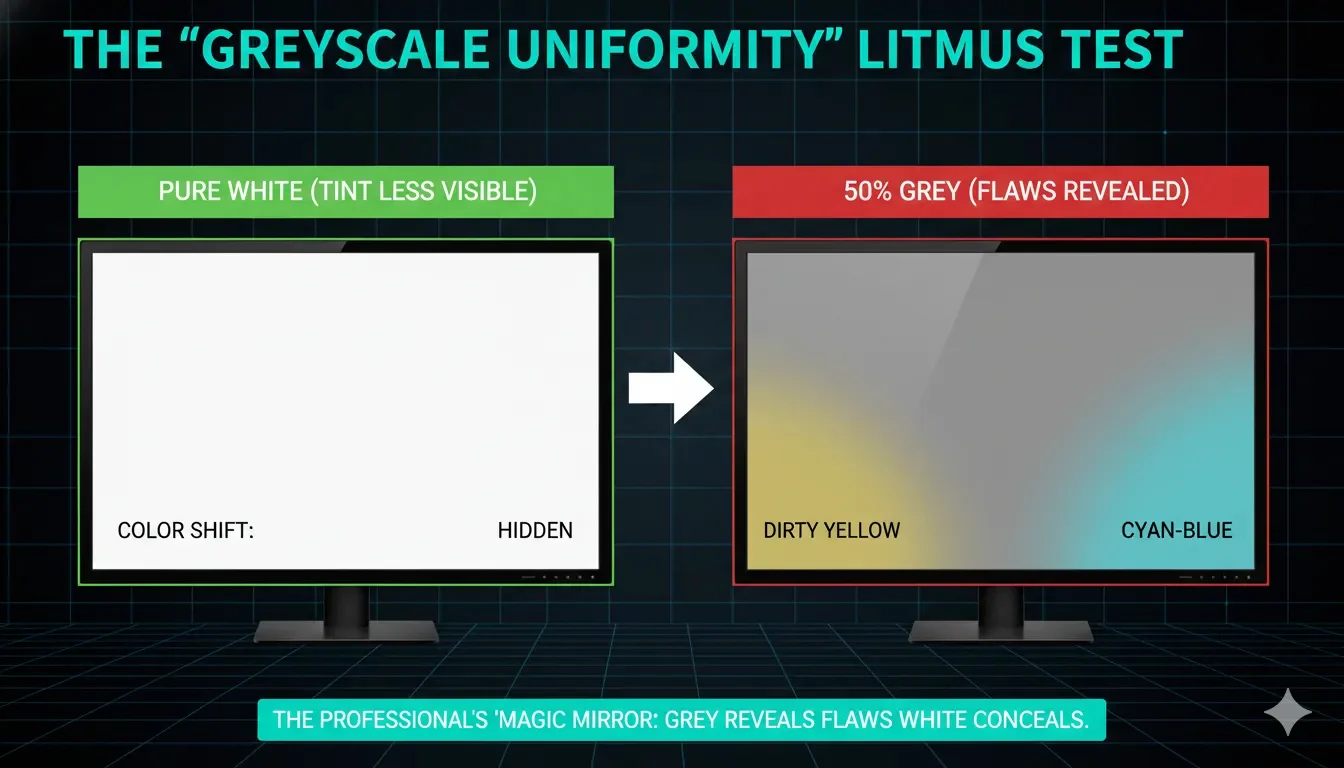
A common failure observed in ultra-wide or large-format IPS monitors (e.g., 34-inch curved productivity screens) is a noticeable color temperature shift across the horizontal axis. One side may appear "Warm" (Yellowish) while the other appears "Cool" (Blueish). This is known as Chromatic Non-uniformity. In a professional UI design environment, this is catastrophic: a neutral grey asset placed on the left looks different than when it’s placed on the right.
Symptom vs. Verdict
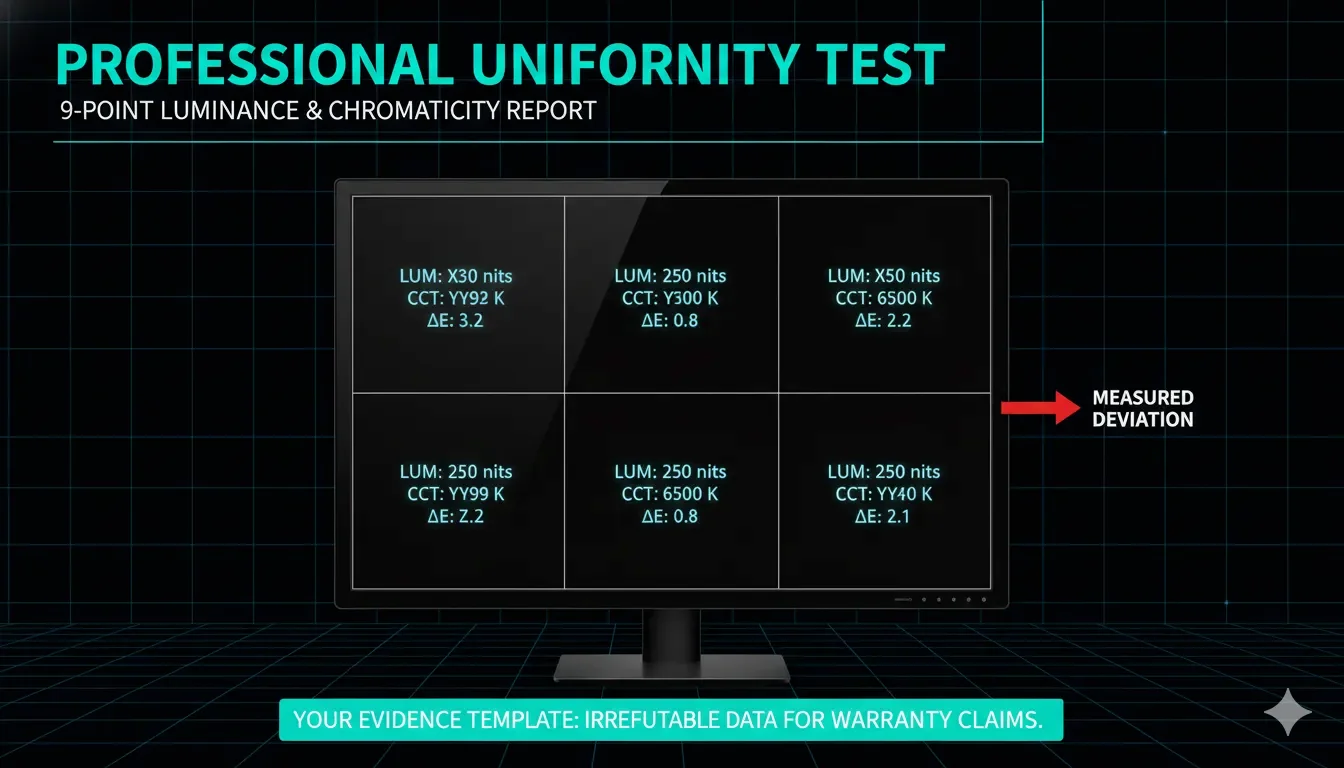
If a customer service rep tells you a ΔE shift of 4.0 is 'within spec,' they are relying on your ignorance. In professional UI/UX work, a color shift across the canvas is a functional failure. Use our 9-point grid to document the exact luminance drop-off. Data is the only language an RMA department fears.
Before you accept a "split-personality" panel, run the Luminance & Chromaticity Uniformity Map. You must quantify the variance to determine if your unit exceeds the Delta E (ΔE) threshold for a professional-grade exchange.
2. The Physics of Imbalance: Why Uniformity Fails
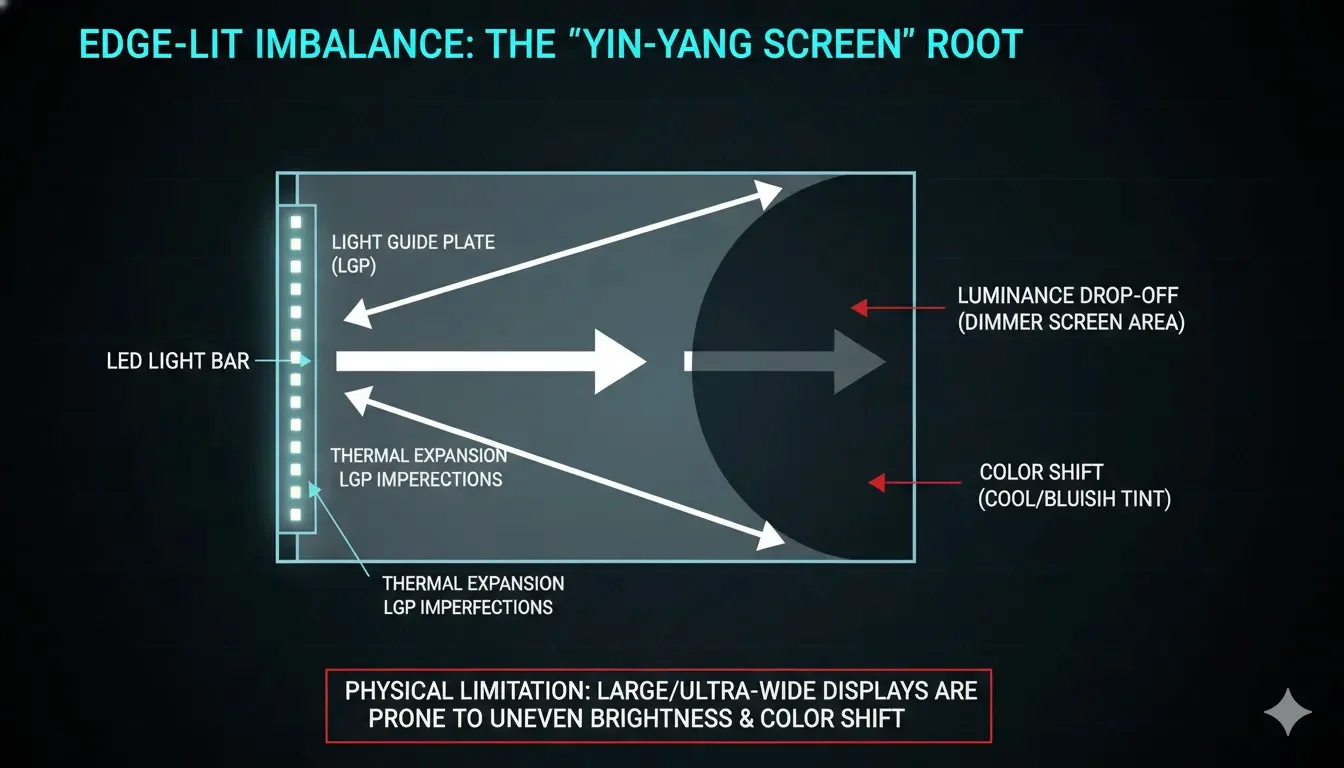
An LCD is a multi-layered sandwich where each layer must be perfectly parallel. Any deviation in the sub-millimeter scale causes visible shifts.
The Uniformity Variance Formula
Luminance Uniformity (UL) is typically measured using a 9-point grid. It is calculated as the ratio between the minimum and maximum measured luminance:
U_L = ( L_min / L_max ) × 100%This percentage is the 'Honesty Metric' of the display industry. While a monitor might claim 400 nits, if its UL is only 75%, you effectively have a 300-nit screen in the corners. Professionalism requires UL > 90%. Anything less is just an office-grade compromise.
- Chromatic Shift: Even if brightness is uniform, the color temperature (Tc) can vary if the Diffuser Sheet or the Light Guide Plate (LGP) has microscopic variations in its refractive index, causing different wavelengths (R/G/B) to scatter unevenly.
| Cause | Physical Mechanism | Visual Symptom | Fixability |
|---|---|---|---|
| Assembly Stress | Bezel pinching the panel edges | Dark corners or "Yellow" patches | Low (Sometimes un-screwing helps) |
| LGP Degradation | Heat warping the acrylic light guide | Global color "split" (Left vs Right) | Zero (Hardware Flaw) |
| Phosphor Inconsistency | Variations in LED coating in the string | Banding or localized "tints" | Zero |
| Cell Gap Variation | Liquid crystal layer thickness drift | Wide-area color temperature shift | Zero |
Engineering Reality
At ScreenTest.run, our database reveals a cold statistical truth: Curved monitors are 40% more likely to fail our chromatic uniformity audit than flat panels. The mechanical tension required to maintain that curve often results in 'Cell Gap' drift. If you bought a 1000R curve and you see a yellow tint on the left, you aren't looking at a defect; you're looking at the physical price of that curvature.
3. System Logic: The "Uniformity Compensation" Band-Aid
Some high-end "Pro" monitors (like the Dell UltraSharp U-series or Eizo ColorEdge) attempt to fix this via Digital Uniformity Correction (DUC).
The DUC Trade-off
- How it works: The monitor’s internal processor stores a "correction map." It artificially dims the brighter/cleaner areas of the screen to match the darkest/most tinted area.
- The Negative Impact: Using DUC significantly reduces your Contrast Ratio and Peak Brightness.
Digital Uniformity Correction is a desperate software fix for bad hardware. To make the corners look as 'white' as the center, the monitor's processor cripples the center's performance. You end up with a uniform screen that has the contrast ratio of a monitor from 2010. Don't pay a premium for a feature that only masks mediocrity. - OS Setup:
These software-side "enhancements" can exacerbate the perception of color shifts by boosting saturation in already tinted regions.Ensure your GPU's "Color Enhancement" settings are OFF in the NVIDIA/AMD control panel.
4. Real-World Diagnostic: The ScreenTest.run Evidence
Our lab tests at ScreenTest.run comparing Edge-lit vs. Direct-lit panels revealed the "Thermal Drift" of Yin-Yang screens.
Observation Data:
- Scenario A (The Thermal Shift): Many monitors start uniform but develop "Yin-Yang" symptoms after 2 hours of use. This is caused by the LED Bar (usually located at the bottom or side) heating up the LGP, causing it to expand unevenly.
- Scenario B (The Viewing Angle Trap): On large IPS screens, what looks like "Yin-Yang" color shifting is often just IPS Glow coupled with the user sitting too close.
Note from the Lab
We tested a batch of "Premium 4K" displays and found that 30% had a ΔE variance of over 4.5 between the left and right quadrants. For context, any ΔE > 3 is considered unacceptable for professional color grading.
5. Professional Checklist: How to Quantify and Counter "Yin-Yang"
- The 2-Meter Rule: Stand 2 meters back and view a Screentest.run Pure White Screen. If the color shift persists, it is a hardware defect. If it disappears, it was simply "Viewing Angle Shift."
- The 9-Point Audit: Divide your screen into a 3x3 grid. Use a colorimeter (if available) or compare white balance using a high-quality smartphone camera in Pro Mode (Fixed White Balance). If the color temperature shift exceeds 500K, the panel is poorly binned.
- Check the Bezel Tension: If the tint is localized to an edge, check if the monitor frame is overly tight. Sometimes, VESA mount pressure can "bow" the panel, creating a center-vs-edge color split.
- Avoid "Eco Mode": Many monitors have aggressive power-saving features that dim the backlight unevenly at low power levels, making "Yin-Yang" symptoms look much worse than they actually are.
- Final Validation: Use the Screentest.run Grey Uniformity Test (50% Grey). Grey is far more sensitive to color shifts than White. If the grey looks "pink" on one side and "cyan" on the other, the unit is unfit for professional design work.
Conclusion
Yin-Yang Screen is the physical manifestation of manufacturing tolerances losing the battle against panel size. While Digital Uniformity Correction offers a software-level bandage, it comes at the cost of your monitor’s dynamic range. As a professional, you must decide: is the shift within your "perceptual tolerance," or is it a documented defect? By using the 9-point quantification method on ScreenTest.run, you move beyond "it looks weird" to "this panel has a 15% luminance drop-off," giving you the technical evidence needed for a successful RMA. Don't let the manufacturer tell you it’s "normal"—if your eyes see two different monitors in one frame, the hardware has failed its primary mission.
Validate Your Screen Uniformity Now
Don't settle for "Yin-Yang" color defects. Use our professional tools to run a 9-point audit and quantify your display's performance today.
Test Screen Uniformity